Purpose: The purpose of this lab is to create a position vs time graph, and learn how to understand the relationship between velocity, acceleration, and time.
Equipment:
Ti-84 Calculator
Lab Quest
Motion Detector
Meter Stick
Graph Paper
Ti-84 Calculator
Lab Quest
Motion Detector
Meter Stick
Graph Paper
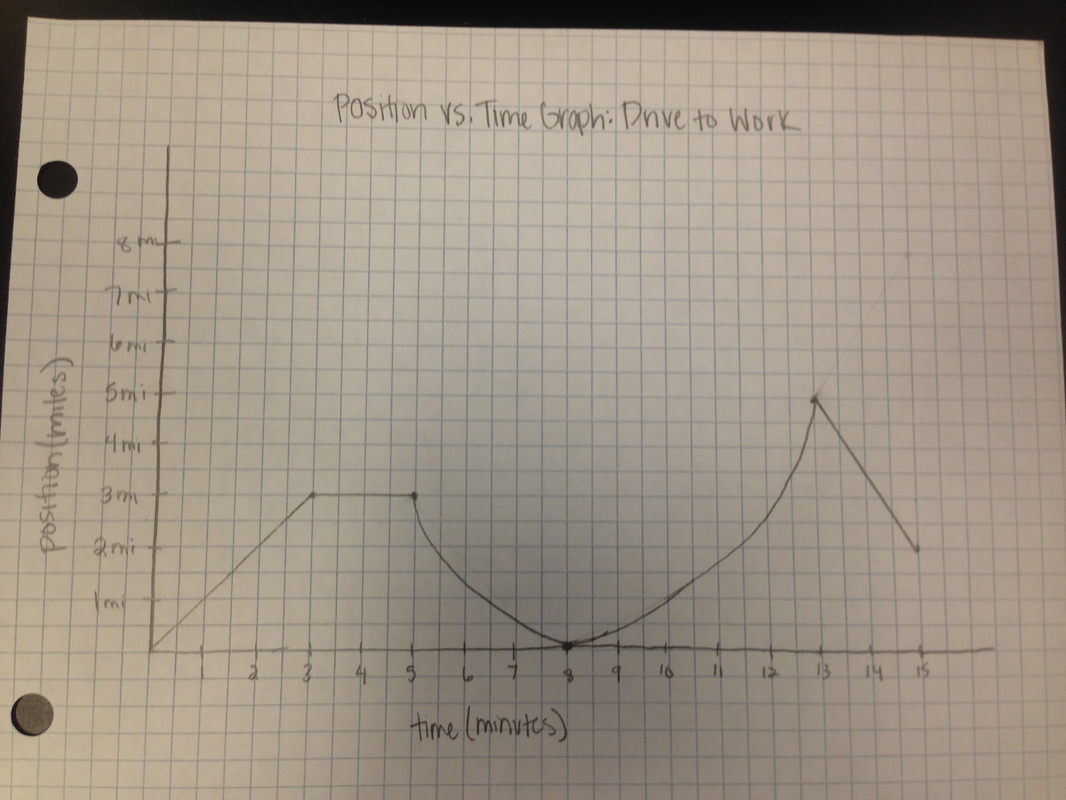
Procedure: Drive to Work
1. On a sunny Monday morning, George started off going 60 mph for 3 minutes.
2. Suddenly, a traffic jam occurs, and George has to sit at a
stand still for 2 minutes.
3. As he crossed the bridge, a giant buffalo herd was in his path and he had to retrace his path for the next 3 minutes.
4. Next, George realized that it was just an elephant blocking the road and he
slowly increased his velocity for the next 5 minutes.
5. A wild lion ran out of the woods and chased the buffalo away, and George was then able to go backwards for the last 2 minutes to work.
6. As soon as he pulls in the parking lot, George is abducted by aliens and
disappears.
All on a normal Monday morning on the way to work.
Data/ Data Analysis
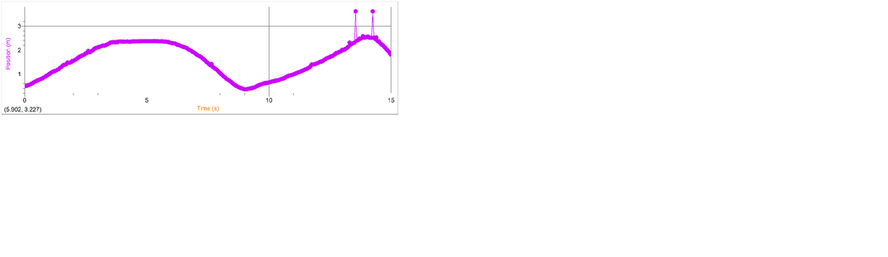
Conclusion: During this lab we learned how to use the motion sensor while also learning the relationship between position and time. As time goes by, the position of the particle also changes unless it is unmoving. If this occurs, the velocity is zero. As seen in our data, the graph we made with the motion sensor directly correlates with the graph we drew. However there could have been a few errors where the motion sensor did not pick up the book we were using to signal it, causing jumps in the graph. This lab did a great job helping us understand the relationship between time and position, and taught us how to use the motion sensor.
 RSS Feed